python 绘制海底地形图
本文介绍了如何使用GEBCO网站下载海底地形数据,并通过OpenCV和Python进行数据处理与可视化。主要内容包括:1)从GEBCO官网下载特定区域的GeoTIFF格式海底地形数据;2)使用OpenCV读取TIFF文件并提取指定经纬度的海拔/水深数据;3)通过Python实现数据可视化,使用Cartopy库绘制中国东海区域地图,并采用分层着色方案显示不同水深区域。文中提供了完整的代码示例,包括数
·
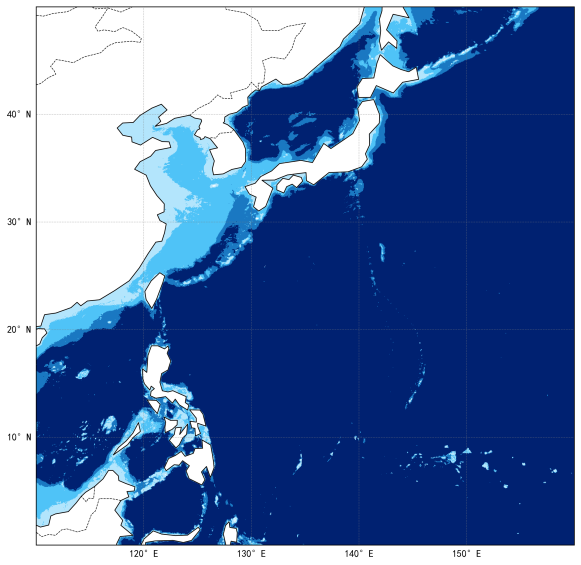
绘制效果
数据源下载
来自https://www.gebco.net/
在这个网站下载
https://www.gebco.net/data-products/gridded-bathymetry-data
不需要注册。
点击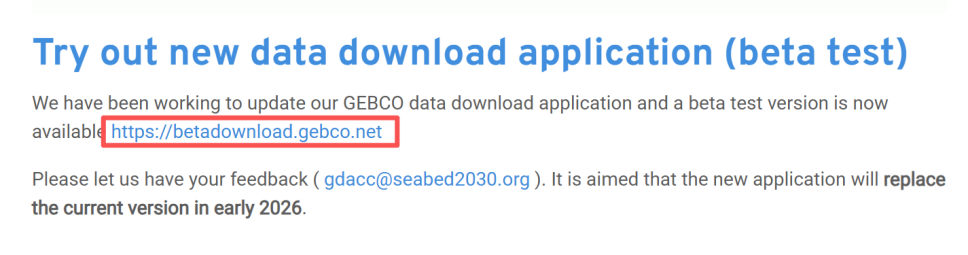
打开新的下载测试应用。
按住ctrl键绘制矩形区域,然后点击下图按钮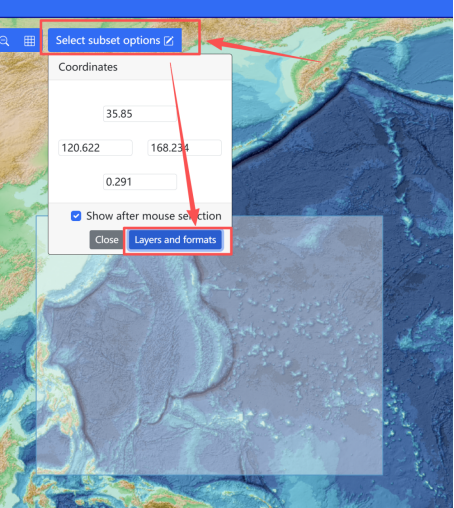
然后选择需要下载的类型类型和格式。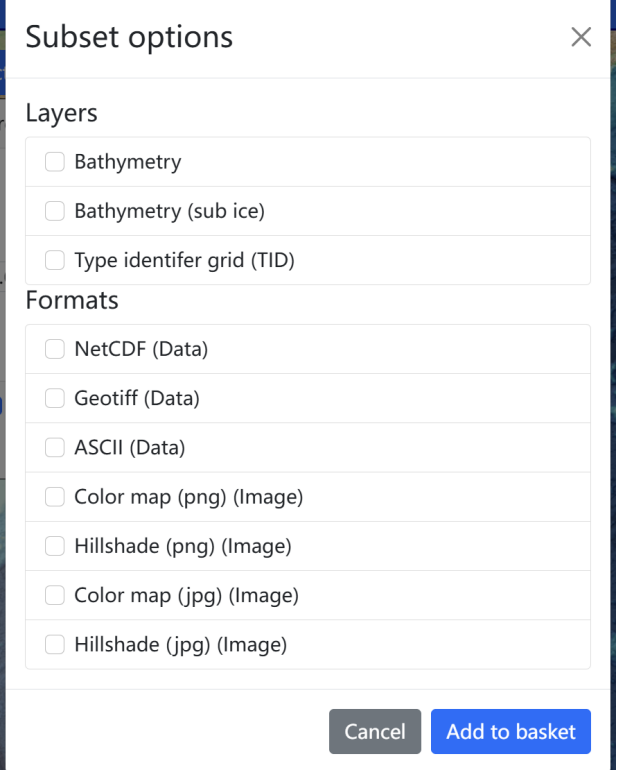
下载完成后,如下所示: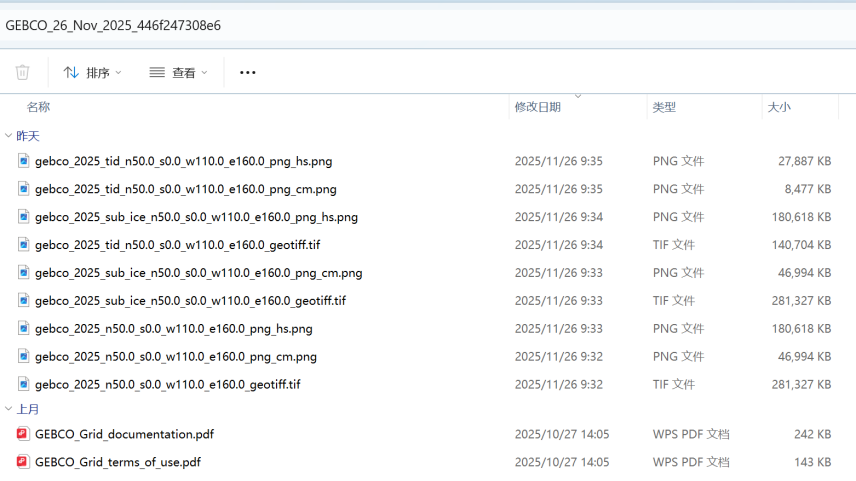
opencv读取深度数据
针对gebco_2025_n50.0_s0.0_w110.0_e160.0_geotiff.tif图像,可以使用opencv进行读取,并得到固定经纬度的海拔高度,海上是负值,代表水深。
 	cv::Mat image = cv::imread("D:/gebco_2025_n50.0_s0.0_w110.0_e160.0_geotiff.tif", cv::IMREAD_UNCHANGED);

    // 获取图像基本信息
    int width = image.cols;
    int height = image.rows;
    int channels = image.channels();
    int depth = image.depth();
    auto type = image.type();

    std::cout << "W: " << width << ",H: " << height << ",C: " << channels << ",D:" << depth << std::endl;

    //已知图像表示的范围是从 北纬50度到0度  东经110度到东经160度
    // 根据输入的经纬度,直接得到对应的
    float lon = 128;
    float lat = 26;
    int xindex = (lon - 110) * width / (160-110);
    int yindex = (50 - lat) * height / (50 - 0);
    if (xindex < 0)
        xindex = 0;
    if (xindex >= width)
        xindex = width - 1;
    if (yindex >= height)
        yindex = height - 1;
    auto a = image.at<int16_t>(yindex, xindex);  // 获取到海拔高度,海上是负值

	return 1;
python可视化
import matplotlib.pyplot as plt
import cartopy.crs as ccrs
import cartopy.feature as cfeature
import numpy as np
import matplotlib
from matplotlib.colors import LinearSegmentedColormap, BoundaryNorm
import os
from scipy import interpolate
import tifffile as tiff


def _load_tiff_data(tiff_path: str):
    """
    加载TIFF数据,使用类变量缓存
    """
    import tifffile as tiff
    from scipy import interpolate

    # 读取TIFF文件
    image_array = tiff.imread(tiff_path)
    assert image_array.dtype == np.int16
    assert image_array.shape == (12000, 12000)

    # TIFF文件覆盖的地理范围
    tiff_lon_range = [110, 160]
    tiff_lat_range = [50, 0]

    # 创建插值器
    tiff_xxx = np.linspace(tiff_lon_range[0], tiff_lon_range[1], 12000)
    tiff_yyy = np.linspace(tiff_lat_range[0], tiff_lat_range[1], 12000)

    interpolator = interpolate.RegularGridInterpolator(
        (tiff_yyy, tiff_xxx),
        image_array,
        method='linear',
        bounds_error=False,
        fill_value=np.nan
    )

    return image_array, tiff_lon_range, tiff_lat_range,interpolator


def create_east_china_sea_map():
    """
    创建中国东海附近地图,按水深着色
    """
    # 设置中文字体支持
    plt.rcParams['font.sans-serif'] = ['SimHei', 'Microsoft YaHei']
    plt.rcParams['axes.unicode_minus'] = False

    # 创建图形和坐标轴
    fig = plt.figure(figsize=(12, 10), dpi=150)
    ax = fig.add_subplot(1, 1, 1, projection=ccrs.PlateCarree())

    # 设置区域范围
    lon_range = (110, 160)
    lat_range = (0, 50)

    ax.set_extent([lon_range[0], lon_range[1], lat_range[0], lat_range[1]], crs=ccrs.PlateCarree())

    # 添加陆地
    ax.add_feature(cfeature.LAND, color = "white", alpha=1, zorder=1)

    # 添加海岸线
    ax.add_feature(cfeature.COASTLINE, linewidth=0.8, zorder=2)

    # 添加国界线
    ax.add_feature(cfeature.BORDERS, linewidth=0.6, linestyle='--', zorder=2)

    # 设置网格线
    gl = ax.gridlines(
        draw_labels=True,
        linewidth=0.5,
        color='gray',
        alpha=0.5,
        linestyle='--'
    )
    gl.top_labels = False
    gl.right_labels = False
    gl.xlabel_style = {'size': 10}
    gl.ylabel_style = {'size': 10}


    # 分级颜色映射
    # depth_bounds = [-500, 0, 50, 200, 3000]  # 水深分级:0-10m, 10-200m, 50m以上
    # depth_colors = ["#63E7FF", "#63E7FF", "#CEFFFF", "#FFFFFF"]
    # 在您的create_chart方法中替换相应的部分:
    depth_bounds = [-500, 50, 200,1000, 3000]  # 修改水深分级
    depth_colors = ["#B3E5FC", "#4FC3F7", "#1A78C2", "#0D47A1", "#002171"]  # 新的颜色方案

    # 获取脚本当前目录
    script_dir = os.path.dirname(os.path.abspath(__file__))
    tiff_path = os.path.join(script_dir, 'n50.0_s0.0_w110.0_e160.0.tif')

    image_array, tiff_lon_range, tiff_lat_range,interpolator = _load_tiff_data(tiff_path)

    # 当前显示区域的网格
    xxx = np.linspace(lon_range[0], lon_range[1], 1200)
    yyy = np.linspace(lat_range[0], lat_range[1], 1200)
    lon_grid, lat_grid = np.meshgrid(xxx, yyy)

    # 使用缓存的插值器
    points = np.column_stack([lat_grid.ravel(), lon_grid.ravel()])
    interp_result = interpolator(points)
    interp_result = interp_result.reshape(lon_grid.shape)

    # 处理水深数据:将陆地(正值)设为NaN,不绘制
    interp_masked = np.where(interp_result > -depth_bounds[0], np.nan, -interp_result)

    # 创建自定义颜色映射:按照你的要求分级
    from matplotlib.colors import LinearSegmentedColormap, BoundaryNorm

    # 创建分段的颜色映射
    custom_cmap = LinearSegmentedColormap.from_list("OceanDepth", depth_colors, N=len(depth_bounds))
    norm = BoundaryNorm(depth_bounds, custom_cmap.N)

    # 应用颜色映射 - 使用分级映射
    cs = ax.pcolormesh(
        lon_grid, lat_grid, interp_masked,
        cmap=custom_cmap,
        norm=norm,
        transform=ccrs.PlateCarree(),
        zorder=0
    )

    # 保存图片
    plt.savefig('bathymetry.png', dpi=300, bbox_inches='tight')
    plt.show()

    return fig, ax


def load_real_bathymetry_data(tiff_path):
    """
    加载真实的TIFF水深数据(如果可用)
    基于NauticalChart类的逻辑[1](@ref)
    """
    try:
        # 读取TIFF文件
        image_array = tiff.imread(tiff_path)

        # 假设TIFF文件的地理范围(需要根据实际文件调整)
        tiff_lon_range = [120, 130]  # 根据实际文件调整
        tiff_lat_range = [25, 35]  # 根据实际文件调整

        # 创建插值器
        tiff_lon_points = np.linspace(tiff_lon_range[0], tiff_lon_range[1], image_array.shape[1])
        tiff_lat_points = np.linspace(tiff_lat_range[0], tiff_lat_range[1], image_array.shape[0])

        interpolator = interpolate.RegularGridInterpolator(
            (tiff_lat_points, tiff_lon_points),
            image_array,
            method='linear',
            bounds_error=False,
            fill_value=np.nan
        )

        return image_array, interpolator, tiff_lon_range, tiff_lat_range

    except Exception as e:
        print(f"加载真实水深数据失败: {e}")
        return None, None, None, None


if __name__ == "__main__":
    # 创建东海地图
    print("正在生成中国东海海底地形图...")
    fig, ax = create_east_china_sea_map()
    print("地图生成完成!已保存为 'east_china_sea_bathymetry.png'")
显示效果如下:

火山引擎开发者社区是火山引擎打造的AI技术生态平台,聚焦Agent与大模型开发,提供豆包系列模型(图像/视频/视觉)、智能分析与会话工具,并配套评测集、动手实验室及行业案例库。社区通过技术沙龙、挑战赛等活动促进开发者成长,新用户可领50万Tokens权益,助力构建智能应用。
更多推荐
 7
7 0
0- 0


 已为社区贡献1条内容

所有评论(0)