AI代码开发宝库系列:Qwen Agent 运用
在当今这个数据驱动的时代,餐饮行业也需要紧跟潮流,用AI技术来提升营收分析能力!今天我要给大家分享一个超实用的AI餐饮分析助手项目,它不仅能帮你分析餐厅营收数据,还能告诉你哪些因素对收入影响最大,简直是餐饮老板的得力助手!
AI餐饮分析助手:让你的餐厅营收数据开口说话!

在当今这个数据驱动的时代,餐饮行业也需要紧跟潮流,用AI技术来提升营收分析能力!今天我要给大家分享一个超实用的AI餐饮分析助手项目,它不仅能帮你分析餐厅营收数据,还能告诉你哪些因素对收入影响最大,简直是餐饮老板的得力助手!
项目亮点抢先看
这个AI餐饮分析助手可不是简单的聊天机器人,它具备以下超能力:
-
智能SQL查询 - 能听懂你的自然语言并自动生成SQL语句查询数据库
-
深度数据分析 - 通过机器学习算法分析影响营收的关键因素
-
可视化展示 - 自动生成直观的图表帮助你理解数据
-
多维度洞察 - 从不同角度分析餐饮消费模式
结果抢先看
执行 终端显示如下
正在启动 Web 界面...
助手初始化成功!
Web 界面准备就绪,正在启动服务...
* Running on local URL: http://127.0.0.1:7860To create a public link, set `share=True` in `launch()`.
attendance_type=ap marquee_event=4
target_type= 总消费
e:\C\AI大模型应用第15期\9-Function Calling与协作\CASE-ticket-agent\assistant_revenue_bot.py:355: SettingWithCopyWarning:
A value is trying to be set on a copy of a slice from a DataFrame.
Try using .loc[row_indexer,col_indexer] = value insteadSee the caveats in the documentation: https://pandas.pydata.org/pandas-docs/stable/user_guide/indexing.html#returning-a-view-versus-a-copy
df['date'] = pd.to_datetime(df[date_col])
e:\C\AI大模型应用第15期\9-Function Calling与协作\CASE-ticket-agent\assistant_revenue_bot.py:359: SettingWithCopyWarning:
A value is trying to be set on a copy of a slice from a DataFrame.
Try using .loc[row_indexer,col_indexer] = value insteadSee the caveats in the documentation: https://pandas.pydata.org/pandas-docs/stable/user_guide/indexing.html#returning-a-view-versus-a-copy
df['date_diff'] = (df[date_col] - reference_date).dt.days
e:\C\AI大模型应用第15期\9-Function Calling与协作\CASE-ticket-agent\assistant_revenue_bot.py:362: FutureWarning: A value is trying to be set on a copy of a DataFrame or Series through chained assignment using an inplace method.
The behavior will change in pandas 3.0. This inplace method will never work because the intermediate object on which we are setting values always behaves as a copy.For example, when doing 'df[col].method(value, inplace=True)', try using 'df.method({col: value}, inplace=True)' or df[col] = df[col].method(value) instead, to perform the operation inplace on the original object.
df[target].fillna(df[target].mean(), inplace=True)
e:\C\AI大模型应用第15期\9-Function Calling与协作\CASE-ticket-agent\assistant_revenue_bot.py:376: FutureWarning: Downcasting behavior in `replace` is deprecated and will be removed in a future version. To retain the old behavior, explicitly call `result.infer_objects(copy=False)`. To opt-in to the future behavior, set `pd.set_option('future.no_silent_downcasting', True)`
df['week_days'] = df['week_days'].replace(weekdays_mapping)
核心代码解析
1. 智能工具注册系统
首先,让我们看看这个AI助手是如何拥有各种超能力的:
python
# 注册SQL查询工具
@register_tool('exc_sql')
class ExcSQLTool(BaseTool):
"""
SQL查询工具,执行传入的SQL语句并返回结果。
"""
description = '对于生成的SQL,进行SQL查询'
parameters = [{
'name': 'sql_input',
'type': 'string',
'description': '生成的SQL语句',
'required': True
}]
def call(self, params: str, **kwargs) -> str:
import json
args = json.loads(params)
sql_input = args['sql_input']
engine = get_engine()
try:
df = pd.read_sql(sql_input, engine)
return df.head(10).to_markdown(index=False)
except Exception as e:
return f"SQL执行出错: {str(e)}"
这段代码展示了如何将数据库查询能力注册为AI助手的工具。当用户询问关于营收数据的问题时,AI会自动生成相应的SQL语句并通过这个工具执行查询。
2. 智能营收分析引擎
接下来是这个项目的精华部分 - 营收影响因素分析:
python
# 分析哪些因素对餐饮消费的变大影响较大
def analysis_influence_factors(target_type='总消费', engine=None):
    print('target_type=', target_type)
    target_map = {'总消费': 'total_fb_revenue', '人均消费': 'rev_per_cap'}
    target = target_map[target_type]
    if engine is None:
        engine = get_engine()
    # 获取数据
    df = get_q4_data(engine, target)
    # 通过决策树,构建餐饮消费模型
    model, features = build_cart_model(df, target)
    # 决策树可视化
    result = cart_feature_importance(model, features)
    return result
这个函数通过决策树算法分析影响餐饮消费的关键因素,并生成可视化图表,让用户一目了然地看到哪些因素最重要。
3. 机器学习模型构建
python
# 通过决策树,构建餐饮消费模型
def build_cart_model(df, target):
    df_sql = df.copy()
    df_sql['POO outside BJ'] = 100-df_sql['beijing_guest_ratio']
    df_sql['Pass Revisit %'] = df_sql['ap_attendance'] / df_sql['total_attendance'] * 100
    df_sql.rename(columns={'total_attendance':'Att', 'operating_hours':'Park Hrs', 'max_temperature':'Max Temp'}, inplace=True)
    df = df_sql[['date', 'week_days', 'Att', 'Pass Revisit %', 'Max Temp', 'POO outside BJ', 'Park Hrs'] + [target]]

    # 数据预处理
    date_col = 'date'
    df['date'] = pd.to_datetime(df[date_col])
    reference_date = pd.to_datetime('2023-01-01')
    df['date_diff'] = (df[date_col] - reference_date).dt.days
    df = df.drop(['date'], axis=1)

    # 特征工程
    weekdays_mapping = {
        'Monday': 1, 'Tuesday': 2, 'Wednesday': 3,
        'Thursday': 4, 'Friday': 5, 'Saturday': 6, 'Sunday': 7,
    }
    df['week_days'] = df['week_days'].replace(weekdays_mapping)

    # 分割数据集
    features = [x for x in df.columns if x != target]
    X_train, X_test, y_train, y_test = train_test_split(df[features], df[target], test_size=0.2, random_state=42)

    # 创建决策树回归模型
    model = DecisionTreeRegressor(random_state=42, max_depth=4)
    model.fit(X_train, y_train)
    return model, features
这段代码展示了如何使用决策树算法构建餐饮消费预测模型,通过分析历史数据找出影响营收的关键因素。
实际应用场景
这个AI餐饮分析助手可以在多个场景中发挥巨大作用:
1. 餐厅经营决策支持
餐厅老板可以询问:"哪些因素对我们的餐饮收入影响最大?"AI助手会分析历史数据,告诉你答案,比如天气、节假日、客流量等。
2. 营销活动效果评估
在举办促销活动后,可以询问:"这次万圣节活动对人均消费有什么影响?"AI助手会分析活动期间的数据,给出详细报告。
3. 菜单和定价策略优化
通过分析不同时间段、不同客户群体的消费习惯,AI助手可以为菜单设计和定价策略提供数据支持。
4. 人员配置优化
根据历史客流数据和天气等因素,AI助手可以预测未来某个时段的客流量,帮助餐厅合理安排人员。
未来发展方向
这个项目还有巨大的扩展空间:
-
实时数据接入 - 连接实时销售系统,提供实时分析
-
移动端应用 - 开发手机APP,随时随地查看分析结果
-
多店铺管理 - 支持连锁餐厅的多店铺数据对比分析
-
预测功能增强 - 基于历史数据预测未来营收趋势
-
个性化推荐 - 根据客户消费习惯推荐菜品
当用户输入"请计算万圣节期间的年卡用户园内人均餐饮消费"时,整个流程是如何跑通的?
当用户输入这个查询时,AI餐饮分析助手会经历以下完整的处理流程:
1. 用户输入处理阶段
用户在Web界面或终端输入:"请计算万圣节期间的年卡用户园内人均餐饮消费"
2. 大模型理解与工具选择阶段
-
系统提示理解:AI助手首先根据system_prompt理解自己的角色是餐饮分析助手,并了解数据库表结构。
-
意图识别:大模型分析用户请求,识别出这是一个需要计算特定条件下人均餐饮消费的请求。
-
工具匹配:根据functions_desc中定义的工具,大模型决定调用compute_avg_revenue工具。
-
参数提取
:大模型从用户请求中提取关键参数:
-
attendance_type: "ap" (年卡用户)
-
marquee_event: "Halloween Horror Night" (万圣节)
-
3. 工具调用与执行阶段
3.1 ComputeAvgRevenueTool调用
当大模型决定调用compute_avg_revenue工具时,会触发ComputeAvgRevenueTool类的call方法:
python
def call(self, params: str, **kwargs) -> str:
    import json
    args = json.loads(params)
    attendance_type = args['attendance_type']  # "ap"
    marquee_event = args.get('marquee_event', '无活动')  # "Halloween Horror Night"
    engine = get_engine()
    return compute_avg_revenue(attendance_type, marquee_event, engine)
3.2 compute_avg_revenue函数执行
compute_avg_revenue函数是整个流程的核心,它会按步骤执行:
步骤1: 参数转换
python
if isinstance(marquee_event, str):
    marquee_event_map = {'无活动': 0, 'Chinese New Year': 1, 'Honor Of King': 2, 'Cool Summer': 3, 'Halloween Horror Night': 4}
    marquee_event = marquee_event_map.get(marquee_event, 0)  # 将"Halloween Horror Night"转换为4
步骤2: 数据获取
调用get_q3_data函数从数据库获取万圣节期间的餐饮消费数据:
python
def get_q3_data(engine, marquee_event):
    with engine.connect() as conn:
        query_sql = """SELECT date, ap_attendance, ticket_attendance,
                   promotional_ticket_attendance, total_fb_revenue
                   FROM ubr_revenue    WHERE marquee_event= :marquee_event"""
        params={"marquee_event": marquee_event}  # 此时marquee_event为4(万圣节)
        result = conn.execute(text(query_sql), params)
        news_list = [dict(row) for row in result.mappings()]
        df = pd.DataFrame(news_list)
    return df
步骤3: 构建线性回归模型
调用build_lr_model函数基于获取的数据构建线性回归模型:
python
def build_lr_model(df):
    # 数据预处理
    date_col = 'date'
    df['date'] = pd.to_datetime(df[date_col])
    reference_date = pd.to_datetime('2023-01-01')
    df['date_diff'] = (df['date'] - reference_date).dt.days
    df = df.drop(['date'], axis=1)

    # 准备特征和目标变量
    filtered_cols = df.columns.tolist()
    if date_col in filtered_cols:
        filtered_cols.remove(date_col)
    filtered_cols.remove('total_fb_revenue')

    X = df[filtered_cols]  # 特征:ap_attendance, ticket_attendance, promotional_ticket_attendance
    y = df['total_fb_revenue']  # 目标:total_fb_revenue

    # 向量化处理
    dvec=DictVectorizer(sparse=False)
    train_features=dvec.fit_transform(X.to_dict(orient='records'))

    # 创建并训练线性回归模型
    model = LinearRegression()
    model.fit(train_features, y)
    return model, dvec
步骤4: 计算特征重要性
调用compute_feature_importance函数分析模型特征重要性:
python
def compute_feature_importance(model, dvec):
    # 获取特征系数
    feature_importance = model.coef_

    # 构建特征重要性DataFrame
    feature_df = pd.DataFrame(columns=['feature', 'value'])
    feature_df['value'] = model.coef_
    feature_df['feature'] = dvec.feature_names_
    feature_df = feature_df.sort_values(by=['value'], ascending=False)

    return feature_df
步骤5: 生成结论
调用make_conclusion函数生成最终的分析结论:
python
def make_conclusion(feature_df):
    # 筛选出value大于0的行(正向影响因素)
    positive_values_df = feature_df[feature_df['value'] > 0]
    # 选取Top 5
    top_5_features = positive_values_df.head(5)['feature']
    top_5_values = positive_values_df.head(5)['value']

    content = '影响餐饮消费的重要特征(数值约大,消费越高)是'
    content += ', '.join(top_5_features)
    content += '他们的线性回归系数分别为: '
    content += ', '.join([str(round(v, 1)) for v in top_5_values])

    return content
4. 结果返回与展示阶段
-
结果生成:compute_avg_revenue函数返回分析结论文本。
-
结果传递:ComputeAvgRevenueTool的call方法将结果返回给大模型。
-
最终响应
:大模型将分析结果以自然语言的形式返回给用户,例如:
根据万圣节期间的数据分析,影响年卡用户园内人均餐饮消费的重要特征是ap_attendance(年卡入园人数),其线性回归系数为12.5。这表明年卡用户数量的增加对餐饮消费有显著的正向影响。
5. 整体流程图
    A[用户输入: 计算万圣节年卡用户人均餐饮消费] --> B[大模型理解意图]
    B --> C[选择compute_avg_revenue工具]
    C --> D[提取参数: attendance_type=ap, marquee_event=万圣节]
    D --> E[调用ComputeAvgRevenueTool.call]
    E --> F[参数转换: 万圣节->4]
    F --> G[调用get_q3_data获取数据]
    G --> H[调用build_lr_model构建模型]
    H --> I[调用compute_feature_importance分析特征]
    I --> J[调用make_conclusion生成结论]
    J --> K[返回结果给大模型]
    K --> L[大模型生成自然语言响应]
    L --> M[展示给用户]
完整可运行代码
import os
import dashscope
from qwen_agent.agents import Assistant
from qwen_agent.gui import WebUI
import pandas as pd
from sqlalchemy import create_engine
from qwen_agent.tools.base import BaseTool, register_tool
from sqlalchemy.sql import text
import time
from sklearn.feature_extraction import DictVectorizer
import numpy as np
from sklearn.model_selection import train_test_split
from sklearn.linear_model import LinearRegression
from sklearn.tree import DecisionTreeRegressor, plot_tree, export_text
from sklearn.metrics import mean_squared_error
import matplotlib.pyplot as plt
# 配置 DashScope
dashscope.api_key = os.getenv('DASHSCOPE_API_KEY', '')
dashscope.timeout = 30 # 设置超时时间为 30 秒
system_prompt = """我是餐饮分析助手,以下是关于餐饮营收表相关的字段,我可能会编写对应的SQL,对数据进行查询
-- 餐饮营收表
CREATE TABLE ubr_revenue (
date DATE,
ticket_price DECIMAL(10, 2),
operating_hours DECIMAL(5, 2),
total_attendance INT COMMENT '总入园人数, = ap_attendance+ticket_attendance+promotional_ticket_attendance',
ap_attendance INT COMMENT '年卡入园人数',
ticket_attendance INT COMMENT '门票入园人数',
promotional_ticket_attendance INT COMMENT '促销票入园人数',
media_cost_index DECIMAL(10, 2),
marquee_event VARCHAR(255) COMMENT '4代表万圣节',
max_temperature DECIMAL(5, 2),
min_temperature DECIMAL(5, 2),
week_days VARCHAR(10),
is_national_holiday BOOLEAN,
beijing_guest_ratio DECIMAL(5, 2)
age_group_0_3 DECIMAL(10, 9),
age_group_4_12 DECIMAL(10, 9),
age_group_13_16 DECIMAL(10, 9),
age_group_17_18 DECIMAL(10, 9),
age_group_19_25 DECIMAL(10, 9),
age_group_26_35 DECIMAL(10, 9),
age_group_36_45 DECIMAL(10, 9),
age_group_46_50 DECIMAL(10, 9),
age_group_51_65 DECIMAL(10, 9),
age_group_65_plus DECIMAL(10, 9),
total_fb_revenue DECIMAL(10, 2) COMMENT '当天总餐饮消费(=年卡入园+门票入园+促销票入园 的餐饮消费总和)',
rev_per_cap DECIMAL(10, 2) COMMENT '当天人均餐饮消费'
);
如果用户想要查询万圣节,使用 marquee_event='4'
如果用户想要统计营收或者消费金额,保留小数点后2位。
每当工具返回结果中包含 image_url 字段时,如 ,需要在总结文字之后,将图片显示出来。这样用户能直接看到图表。
"""
functions_desc=[
{
"name": "exc_sql",
"description": "对于生成的SQL,进行SQL查询",
"parameters": {
"type": "object",
"properties": {
"sql_input": {
"type": "string",
"description": "生成的SQL语句",
}
},
"required": ["sql_input"],
},
},
{
"name": "compute_avg_revenue",
"description": "计算某类用户的园内人均餐饮消费",
"parameters": {
"type": "object",
"properties": {
"attendance_type": {
"type": "string",
"description": "用户类型,三种情况:ap,ticket, promotional。分别代表:年卡,门票,促销票",
},
"marquee_event": {
"type": "string",
"description": "活动类型,5种情况:无活动,Chinese New Year,Honor Of King,Cool Summer,Halloween Horror Night"
}
},
"required": ["attendance_type"],
},
},
{
"name": "analysis_influence_factors",
"description": "分析哪些因素对餐饮消费(总消费 或 人均消费)的变大影响较大",
"parameters": {
"type": "object",
"properties": {
"target_type": {
"type": "string",
"description": "分析目标,2种情况:总消费, 人均消费",
},
},
"required": ["target_type"],
},
},
{
"name": "plot_image",
"description": "如果有画图的python代码,可以通过它来绘制图表",
"parameters": {
"type": "object",
"properties": {
"code_input": {
"type": "string",
"description": "生成的Python绘图代码",
}
},
"required": ["code_input"],
},
},
]
# ====== 数据库连接封装 ======
def get_engine():
"""
获取数据库连接 engine
"""
return create_engine(
f'mysql+mysqlconnector://student123:student321@rm-uf6z891lon6dxuqblqo.mysql.rds.aliyuncs.com:3306/ubr?charset=utf8mb4',
connect_args={'connect_timeout': 10}, pool_size=10, max_overflow=20
)
# ====== 注册 exc_sql 工具 ======
@register_tool('exc_sql')
class ExcSQLTool(BaseTool):
"""
SQL查询工具,执行传入的SQL语句并返回结果。
"""
description = '对于生成的SQL,进行SQL查询'
parameters = [{
'name': 'sql_input',
'type': 'string',
'description': '生成的SQL语句',
'required': True
}]
def call(self, params: str, **kwargs) -> str:
import json
args = json.loads(params)
sql_input = args['sql_input']
database = args.get('database', 'ubr')
engine = get_engine()
try:
df = pd.read_sql(sql_input, engine)
return df.head(10).to_markdown(index=False)
except Exception as e:
return f"SQL执行出错: {str(e)}"
# ====== 注册 compute_avg_revenue 工具 ======
@register_tool('compute_avg_revenue')
class ComputeAvgRevenueTool(BaseTool):
"""
计算某类用户的园内人均餐饮消费
"""
description = '计算某类用户的园内人均餐饮消费'
parameters = [{
'name': 'attendance_type',
'type': 'string',
'description': '用户类型,三种情况:ap,ticket, promotional。分别代表:年卡,门票,促销票',
'required': True
}, {
'name': 'marquee_event',
'type': 'string',
'description': '活动类型,5种情况:无活动,Chinese New Year,Honor Of King,Cool Summer,Halloween Horror Night',
'required': False
}]
def call(self, params: str, **kwargs) -> str:
import json
args = json.loads(params)
attendance_type = args['attendance_type']
marquee_event = args.get('marquee_event', '无活动')
engine = get_engine()
return compute_avg_revenue(attendance_type, marquee_event, engine)
# ====== 注册 analysis_influence_factors 工具 ======
@register_tool('analysis_influence_factors')
class AnalysisInfluenceFactorsTool(BaseTool):
"""
分析哪些因素对餐饮消费(总消费 或 人均消费)的变大影响较大
"""
description = '分析哪些因素对餐饮消费(总消费 或 人均消费)的变大影响较大'
parameters = [{
'name': 'target_type',
'type': 'string',
'description': '分析目标,2种情况:总消费, 人均消费',
'required': True
}]
def call(self, params: str, **kwargs) -> str:
import json
args = json.loads(params)
target_type = args['target_type']
engine = get_engine()
result = analysis_influence_factors(target_type, engine)
# result 应为 dict,包含 image_url 和 tree_rules
if isinstance(result, dict) and 'image_url' in result and 'tree_rules' in result:
return f"{result['tree_rules']}\n\n"
return str(result)
# ====== 注册 plot_image 工具 ======
@register_tool('plot_image')
class PlotImageTool(BaseTool):
"""
如果有画图的python代码,可以通过它来绘制图表
"""
description = '如果有画图的python代码,可以通过它来绘制图表'
parameters = [{
'name': 'code_input',
'type': 'string',
'description': '生成的Python绘图代码',
'required': True
}]
def call(self, params: str, **kwargs) -> str:
import json
args = json.loads(params)
code_input = args['code_input']
# 调用原有业务逻辑函数
return plot_image(code_input)
# 通过marquee_event,获取指定的餐饮消费数据
def get_q3_data(engine, marquee_event):
#marquee_event_int = marquee_event_map.get(marquee_event, 0)
# 直接用 engine.connect()
with engine.connect() as conn:
query_sql = """SELECT date, ap_attendance, ticket_attendance,
promotional_ticket_attendance, total_fb_revenue
FROM ubr_revenue WHERE marquee_event= :marquee_event"""
params={"marquee_event": marquee_event}
result = conn.execute(text(query_sql), params)
news_list = [dict(row) for row in result.mappings()]
df = pd.DataFrame(news_list)
return df
# 基于之前的餐饮数据,构建LR模型 => 计算出 ap, ticket, promotional前面的系数
def build_lr_model(df):
date_col = 'date'
df['date'] = pd.to_datetime(df[date_col])
# 设置一个参考日期,比如2023年1月1日
reference_date = pd.to_datetime('2023-01-01')
# 计算日期差异
df['date_diff'] = (df['date'] - reference_date).dt.days
# 去掉原始日期列
df = df.drop(['date'], axis=1)
# if 'marquee_event' in df.columns:
# df['marquee_event'] = df['marquee_event'].astype('str')
# 将特征和目标变量分开
cols = df.columns
filtered_cols = df.columns.tolist()
# 去掉日期和target字段
if date_col in filtered_cols:
filtered_cols.remove(date_col)
filtered_cols.remove('total_fb_revenue')
#filtered_cols = ['ap_attendance', 'ticket_attendance', 'promotional_ticket_attendance']
X = df[filtered_cols]
y = df['total_fb_revenue']
dvec=DictVectorizer(sparse=False)
train_features=dvec.fit_transform(X.to_dict(orient='records'))
#print(dvec.feature_names_)
# 创建线性回归模型实例
model = LinearRegression()
# 训练模型
model.fit(train_features, y)
return model, dvec
# 洞察模型的 feature_importance
def compute_feature_importance(model, dvec):
# 获取特征重要性
feature_importance = model.coef_
feature_importance = 100.0 * (feature_importance / feature_importance.max())
#print(feature_importance)
#print('数值越大 => 收入越高')
# 绘制feature_importance
#show_feature_importance(dvec.feature_names_, feature_importance)
feature_importance = -100.0 * (feature_importance / feature_importance.max())
#print(feature_importance)
#print('数值越小 => 收入越高')
#show_feature_importance(dvec.feature_names_, feature_importance)
feature_df = pd.DataFrame(columns=['feature', 'value'])
feature_df['value'] = model.coef_
feature_df['feature'] = dvec.feature_names_
feature_df = feature_df.sort_values(by=['value'], ascending=False)
return feature_df
# 通过feature_df,输出结论
def make_conclusion(feature_df):
# 筛选出value大于0的行
positive_values_df = feature_df[feature_df['value'] > 0]
# 选取Top 5
top_5_features = positive_values_df.head(5)['feature']
top_5_values = positive_values_df.head(5)['value']
content = '影响餐饮消费的重要特征(数值约大,消费越高)是'
content += ', '.join(top_5_features)
content += '他们的线性回归系数分别为: '
content += ', '.join([str(round(v, 1)) for v in top_5_values])
return content
# 用户关于计算人均餐饮消费的需求
def compute_avg_revenue(attendance_type, marquee_event=0, engine=None):
print(f'attendance_type={attendance_type} marquee_event={marquee_event}')
if engine is None:
engine = get_engine()
if isinstance(marquee_event, str):
marquee_event_map = {'无活动': 0, 'Chinese New Year': 1, 'Honor Of King': 2, 'Cool Summer': 3, 'Halloween Horror Night': 4}
marquee_event = marquee_event_map.get(marquee_event, 0)
# Step1, 通过marquee_event,获取指定的餐饮消费数据
df = get_q3_data(engine, marquee_event)
# Step2, 基于之前的餐饮数据,构建LR模型 => 计算出 ap, ticket, promotional前面的系数
model, dvec = build_lr_model(df)
# Step3, 洞察模型的 feature_importance
feature_df = compute_feature_importance(model, dvec)
# Step4,整理输出结论
content = make_conclusion(feature_df)
return content
########################### Question 4 ###########################
# 通过marquee_event,获取指定的餐饮消费数据
def get_q4_data(engine, target):
with engine.connect() as conn:
query_sql = f"""SELECT date, ticket_price,\n operating_hours,\n total_attendance,\n ap_attendance,\n ticket_attendance,\n promotional_ticket_attendance,\n media_cost_index,\n marquee_event,\n max_temperature,\n min_temperature,\n week_days,\n is_national_holiday,\n beijing_guest_ratio,\n age_group_0_3,\n age_group_4_12,\n age_group_13_16,\n age_group_17_18,\n age_group_19_25,\n age_group_26_35,\n age_group_36_45,\n age_group_46_50,\n age_group_51_65,\n age_group_65_plus,\n {target}\n FROM ubr_revenue;\n """
result = conn.execute(text(query_sql))
news_list = [dict(row) for row in result.mappings()]
df = pd.DataFrame(news_list)
return df
# 通过决策树,构建餐饮消费模型
def build_cart_model(df, target):
df_sql = df.copy()
df_sql['POO outside BJ'] = 100-df_sql['beijing_guest_ratio']
df_sql['Pass Revisit %'] = df_sql['ap_attendance'] / df_sql['total_attendance'] * 100
df_sql.rename(columns={'total_attendance':'Att', 'operating_hours':'Park Hrs', 'max_temperature':'Max Temp'}, inplace=True)
df = df_sql[['date', 'week_days', 'Att', 'Pass Revisit %', 'Max Temp', 'POO outside BJ', 'Park Hrs'] + [target]]
# 日期字段处理
date_col = 'date'
df['date'] = pd.to_datetime(df[date_col])
# 设置一个参考日期,比如2023年1月1日
reference_date = pd.to_datetime('2023-01-01')
# 计算日期差异
df['date_diff'] = (df[date_col] - reference_date).dt.days
df = df.drop(['date'], axis=1)
# 缺失值填充
df[target].fillna(df[target].mean(), inplace=True)
# week_days字段处理
# 创建星期到数值的映射
weekdays_mapping = {
'Monday': 1,
'Tuesday': 2,
'Wednesday': 3,
'Thursday': 4,
'Friday': 5,
'Saturday': 6,
'Sunday': 7,
}
# 应用映射
df['week_days'] = df['week_days'].replace(weekdays_mapping)
# 选择特征和目标变量
features = [x for x in df.columns if x != target]
#target = 'total_fb_revenue'
# 分割数据为训练集和测试集
X_train, X_test, y_train, y_test = train_test_split(df[features], df[target], test_size=0.2, random_state=42)
# 创建决策树回归模型
model = DecisionTreeRegressor(random_state=42, max_depth=4)
# 训练模型
model.fit(X_train, y_train)
# 预测测试集
predictions = model.predict(X_test)
# 计算均方误差
mse = mean_squared_error(y_test, predictions)
return model, features
# 决策树可视化
def cart_feature_importance(model, features):
# 可视化决策树
plt.figure(figsize=(20, 6))
plot_tree(model, filled=True, feature_names=features, rounded=True, fontsize=7)
# 保存图片到本地
save_dir = os.path.join(os.path.dirname(__file__), 'image_show')
os.makedirs(save_dir, exist_ok=True)
filename = f'tree_{int(time.time()*1000)}.png'
save_path = os.path.join(save_dir, filename)
plt.savefig(save_path)
plt.close()
image_url = os.path.join('image_show', filename)
tree_rules = export_text(model, feature_names=features) # 把feature_names替换成你数据集中的特征名称
print(tree_rules)
result = {}
result['image_url'] = image_url
result['tree_rules'] = tree_rules
return result
# 分析哪些因素对餐饮消费(总消费 或 人均消费)的变大影响较大
def analysis_influence_factors(target_type='总消费', engine=None):
print('target_type=', target_type)
target_map = {'总消费': 'total_fb_revenue', '人均消费': 'rev_per_cap'}
target = target_map[target_type]
if engine is None:
engine = get_engine()
# 获取数据
df = get_q4_data(engine, target)
# 通过决策树,构建餐饮消费模型
model, features = build_cart_model(df, target)
# 决策树可视化
result = cart_feature_importance(model, features)
return result
# 特征重要性,按照从大到小可视化呈现
def show_feature_importance(feature_list, feature_importance):
# 设定阈值
fi_threshold = 10
# 重要特征的下标
important_idx = np.where(feature_importance > fi_threshold)[0]
# 特征名称
important_features = [feature_list[i] for i in important_idx]
# 重要特征
sorted_idx = np.argsort(feature_importance[important_idx])[::-1]
# 可视化
pos = np.arange(sorted_idx.shape[0]) + 0.5
plt.subplot(1, 2, 2)
plt.title('Feature Importance')
plt.barh(pos, feature_importance[important_idx][sorted_idx[::-1]], color='r',align='center')
plt.yticks(pos, [important_features[i] for i in sorted_idx[::-1]])
plt.xlabel('Relative Importance')
plt.draw()
# 保存图像
plt.savefig('1.png')
filename = '1.png'
return filename
#plt.show()
# 绘制图表
def plot_image(code_input):
print('code_input=', code_input)
import re
# 修改生成的matplotlib代码以获取图表对象
modified_code = re.sub(r'plt\.figure\([^)]*\)', r'fg = \g<0>', code_input)
modified_code = modified_code.replace("plt.show()", "")
modified_code = modified_code.replace('\n""\n', '\n"""\n')
print('modified_code=', modified_code)
# 执行修改后的代码,并且在这段代码中,plt 被定义为 pyplot 模块
exec(modified_code, {'plt': plt})
# 保存图片到本地
save_dir = os.path.join(os.path.dirname(__file__), 'image_show')
os.makedirs(save_dir, exist_ok=True)
filename = f'plot_{int(time.time()*1000)}.png'
save_path = os.path.join(save_dir, filename)
plt.savefig(save_path)
plt.close()
image_url = os.path.join('image_show', filename)
return image_url
# ====== 初始化餐饮助手服务 ======
def init_agent_service():
"""初始化餐饮助手服务"""
llm_cfg = {
'model': 'qwen-turbo-2025-04-28',
'timeout': 30,
'retry_count': 3,
}
try:
bot = Assistant(
llm=llm_cfg,
name='餐饮分析助手',
description='餐饮营收与消费分析',
system_message=system_prompt,
function_list=['exc_sql', 'compute_avg_revenue', 'analysis_influence_factors', 'plot_image'], # 只传工具名字符串
)
print("助手初始化成功!")
return bot
except Exception as e:
print(f"助手初始化失败: {str(e)}")
raise
# ====== 终端交互模式 ======
def app_tui():
"""终端交互模式,支持连续对话、文件输入、实时响应"""
try:
# 初始化助手
bot = init_agent_service()
# 对话历史
messages = []
while True:
try:
# 获取用户输入
query = input('user question: ')
# 获取可选的文件输入
file = input('file url (press enter if no file): ').strip()
# 输入验证
if not query:
print('user question cannot be empty!')
continue
# 构建消息
if not file:
messages.append({'role': 'user', 'content': query})
else:
messages.append({'role': 'user', 'content': [{'text': query}, {'file': file}]})
print("正在处理您的请求...")
# 运行助手并处理响应
response = []
for resp in bot.run(messages):
print('bot response:', resp)
messages.extend(response)
except Exception as e:
print(f"处理请求时出错: {str(e)}")
print("请重试或输入新的问题")
except Exception as e:
print(f"启动终端模式失败: {str(e)}")
# ====== Web 图形界面模式 ======
def app_gui():
"""图形界面模式,提供 Web 图形界面"""
try:
print("正在启动 Web 界面...")
# 初始化助手
bot = init_agent_service()
# 配置聊天界面,列举3个典型餐饮分析问题
chatbot_config = {
'prompt.suggestions': [
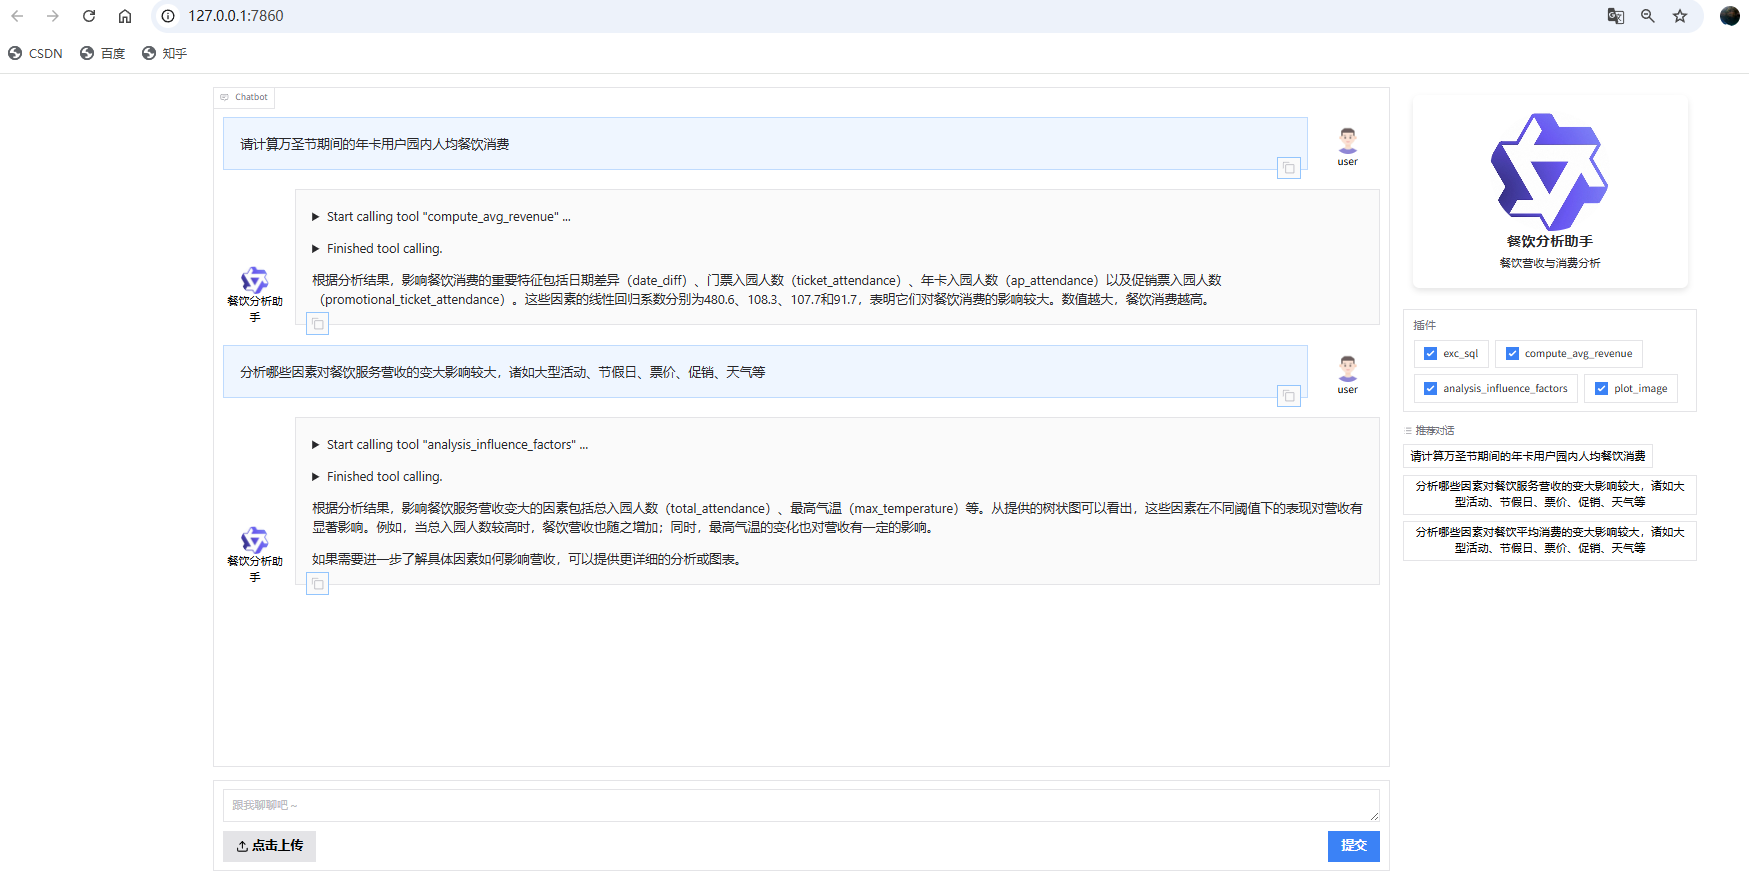
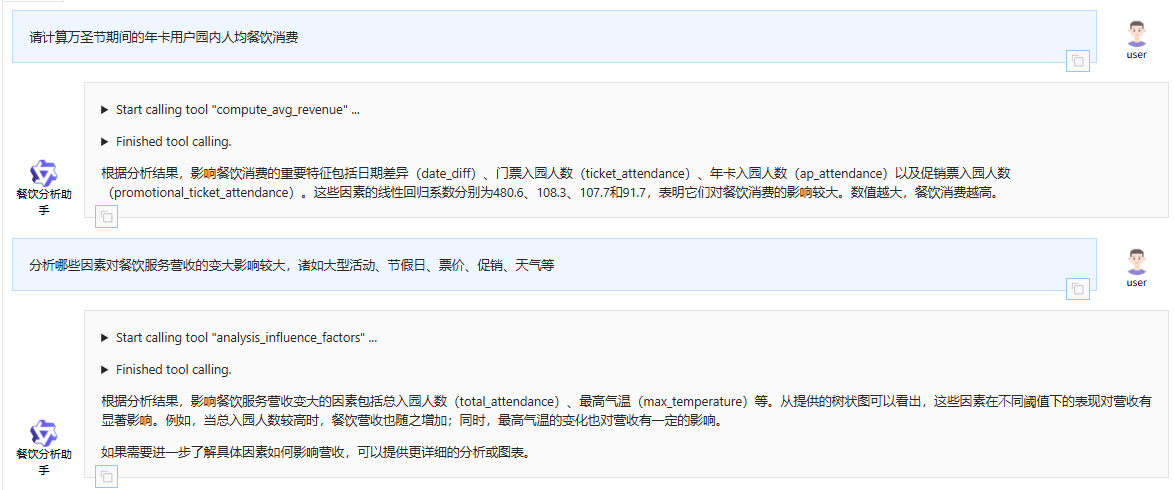
'请计算万圣节期间的年卡用户园内人均餐饮消费',
'分析哪些因素对餐饮服务营收的变大影响较大,诸如大型活动、节假日、票价、促销、天气等',
'分析哪些因素对餐饮平均消费的变大影响较大,诸如大型活动、节假日、票价、促销、天气等'
]
}
print("Web 界面准备就绪,正在启动服务...")
# 启动 Web 界面
WebUI(
bot,
chatbot_config=chatbot_config
).run()
except Exception as e:
print(f"启动 Web 界面失败: {str(e)}")
print("请检查网络连接和 API Key 配置")
# ====== 主程序入口 ======
if __name__ == '__main__':
app_gui() # 默认启动 Web 图形界面

火山引擎开发者社区是火山引擎打造的AI技术生态平台,聚焦Agent与大模型开发,提供豆包系列模型(图像/视频/视觉)、智能分析与会话工具,并配套评测集、动手实验室及行业案例库。社区通过技术沙龙、挑战赛等活动促进开发者成长,新用户可领50万Tokens权益,助力构建智能应用。
更多推荐
 25
25 0
0- 0


 已为社区贡献20条内容

所有评论(0)