SottPlot5曲线图学习,代码示例,最新版本使用总结(v5.1.x)
一、ScottPlot(v5.1.57)
ScottPlot 是一个免费、开源的 .NET 绘图库,专注于高性能、易用性和轻量级,支持 Windows Forms、WPF、ASP.NET、Blazor、MAUI 等多种.NET 平台,适合绘制折线图、散点图、柱状图、热力图等数十种图表类型,尤其适合科学计算、数据可视化场景。
说明:可能版本差异,网上提供的很多方法均无效(包括AI提供的多种方法,几乎都有问题)。
1.1 汉字乱码问题
X轴标签汉字支持:formsPlot.Plot.Axes.Bottom.Label.FontName = “Microsoft YaHei UI”;
Y轴标签汉字支持:formsPlot.Plot.Axes.Left.Label.FontName = “Microsoft YaHei UI”;
标题汉字支持:formsPlot.Plot.Axes.Title.Label.FontName = “Microsoft YaHei UI”;
图例汉字支持:formsPlot.Plot.Legend.FontName = “Microsoft YaHei UI”;
全局字体:formsPlot.Plot.Font.Set(“Microsoft YaHei UI”);
全局字体加粗:formsPlot.Plot.Font.Set(“Microsoft YaHei UI”,FontWeight.Bold);
1.2 曲线图(圆滑曲线图)
默认(直连):var scatterPlot = formsPlot.Plot.Add.Scatter(times, prices);
圆滑(弧度)属性:scatterPlot.Smooth = true;
1.3 图例显示位置控制
右上角(默认右下角):formsPlot.Plot.Legend.Alignment = Alignment.UpperRight;
1.4 网格及坐标轴控制
布满:formsPlot.Plot.Axes.AutoScale();
隐藏网格:formsPlot.Plot.HideGrid();
隐藏坐标轴:formsPlot.Plot.Layout.Frameless(true);
四周边距控制(左右下上):formsPlot.Plot.Layout.Fixed(new PixelPadding(80,20,50,50));
1.5 关于X轴显示时间问题
关键:formsPlot.Plot.Axes.DateTimeTicksBottom();
时间显示格式化:
formsPlot.Plot.Axes.Bottom.TickGenerator = new ScottPlot.TickGenerators.DateTimeAutomatic
{
LabelFormatter = dt => dt.ToString(“HH:mm:ss”)//格式
};
1.6 其他
1.隐藏图例:formsPlot.Plot.Legend.IsVisible = false;
2.隐藏标题:formsPlot.Plot.Axes.Title.IsVisible = false;
3.Y轴标签倾斜:formsPlot.Plot.Axes.Left.Label.Rotation = -45;
4.X轴标签斜角:formsPlot.Plot.Axes.Bottom.Label.Rotation = -45;
5.标题其他样式:formsPlot.Plot.Axes.Title.Label.属性名=值;
6.X轴标签样式:formsPlot.Plot.Axes.Bottom.Label.属性名=值;
7.清空:formsPlot.Plot.Clear();
8.标题:formsPlot.Plot.Title(title);
9.绘制刷新:formsPlot.Refresh();
10.数据区背景色:formsPlot.Plot.DataBackground.Color = ScottPlot.Color.FromHex(“#1f1f1f”);
11.图形背景色:formsPlot.Plot.FigureBackground.Color = ScottPlot.Color.FromHex(“#181818”);
12.隐藏标题:formsPlot.Plot.Title(false);
13.标题位置:formsPlot.Plot.Axes.Title.FullFigureCenter = true;
14.图表外边框样式:
            formsPlot.Plot.FigureBorder = new()
            {//图标区
                Color = Colors.Magenta,
                Width = 1,
                Pattern = LinePattern.Dotted,
            };
15.数据区外边框样式:
            formsPlot.Plot.DataBorder = new()
            {//数据区
                Color = Colors.Green,
                Width = 1,
                Pattern = LinePattern.DenselyDashed,
            };
16.坐标轴隐藏:formsPlot.Plot.Axes.Frame(false);//formsPlot.Plot.Layout.Frameless(true);
17.缩放因子:formsPlot1.Plot.ScaleFactor = 2;//图表放大2倍
18.线条模式(细线单像素)更丝滑:formsPlot.Plot.Axes.Hairline(true);
二、实例测试及个别示例代码
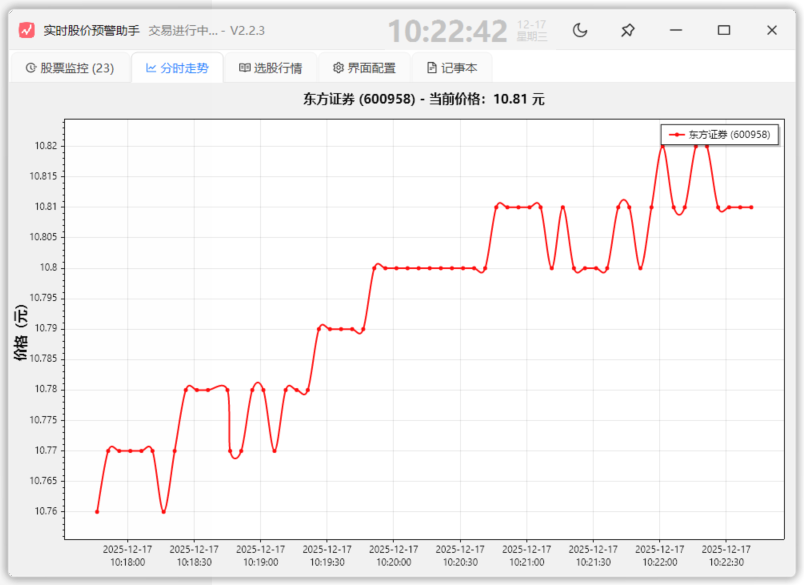
2.1 示例1
2.2 其他示例
2.2.1 Y轴填充
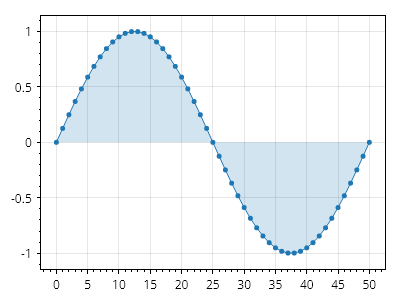
double[] xs = Generate.Consecutive(51);
double[] ys = Generate.Sin(51);
var sp = formsPlot1.Plot.Add.Scatter(xs, ys);
sp.FillY = true;
sp.FillYColor = sp.Color.WithAlpha(.2);
formsPlot1.Refresh();
2.2.2 上填充、下填充
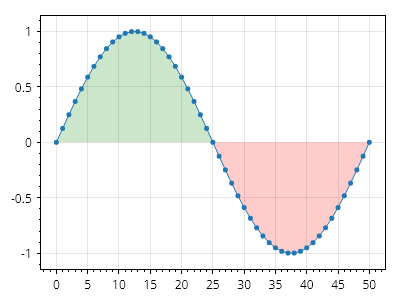
double[] xs = Generate.Consecutive(51);
double[] ys = Generate.Sin(51);
var sp = formsPlot1.Plot.Add.Scatter(xs, ys);
sp.FillY = true;
sp.FillYValue = 0;
sp.FillYAboveColor = Colors.Green.WithAlpha(.2);
sp.FillYBelowColor = Colors.Red.WithAlpha(.2);
formsPlot1.Refresh();
2.2.3 渐变色填充
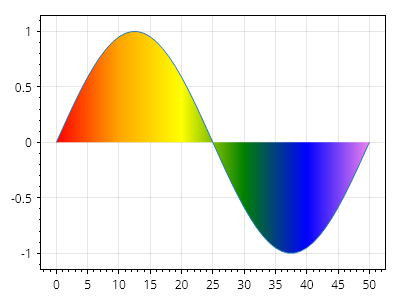
double[] xs = Generate.Consecutive(51);
double[] ys = Generate.Sin(51);

var poly = formsPlot1.Plot.Add.ScatterLine(xs, ys);
poly.FillY = true;

// colors are placed at specific positions on the X axis
poly.AxisGradientDirection = AxisGradientDirection.Horizontal; //放射方向
poly.ColorPositions.Add(new(Colors.Red, 0));
poly.ColorPositions.Add(new(Colors.Orange, 10));
poly.ColorPositions.Add(new(Colors.Yellow, 20));
poly.ColorPositions.Add(new(Colors.Green, 30));
poly.ColorPositions.Add(new(Colors.Blue, 40));
poly.ColorPositions.Add(new(Colors.Violet, 50));

formsPlot1.Refresh();

中国智能体开发者社区,聚焦智能体与大模型开发,提供前沿资讯、实用工具链、开源项目及行业案例。通过技术沙龙、开发者大赛等活动,促进经验交流与协作,助力开发者快速构建创新智能应用。
更多推荐


 25
25 0
0- 0


 已为社区贡献2条内容

所有评论(0)