deepseek r1满血版性能监控+告警
本文详细介绍了如何部署和监控deepseekr1模型。首先,通过下载模型、安装vllm并使用vllm部署deepseekr1,完成模型的安装和启动。接着,通过Prometheus进行监控配置,并利用Grafana进行可视化展示。此外,还设置了Prometheus的告警规则,包括文件描述符告警和GPU缓存压力告警,以确保系统稳定运行。最后,通过alertmanager和PrometheusAlert
·
目录
一、安装deepseek r1
简单操作步骤(也可以基于容器化部署):
1、下载deepseek r1 模型
2、安装vllm
3、使用vllm部署deepseek r1
python /home/ubuntu/.local/bin/vllm serve /data/LLM/models/deepseek-r1/ --tensor-parallel-size 8 --port 8011 --trust-remote-code --served-model-name deepseek-r1 --enable-chunked-prefill --max-num-batched-tokens 2048 --gpu-memory-utilization 0.954、验证
curl http://localhost:8011/v1/chat/completions \
    -H "Content-Type: application/json" \
    -d '{
        "model": "deepseek-r1",
        "messages": [
            {
                "role": "user",
                "content": "你是谁?"
            }
        ]
    }';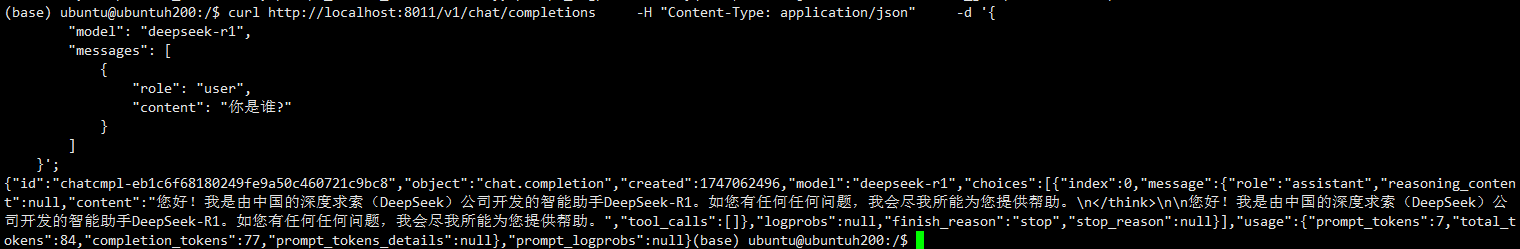
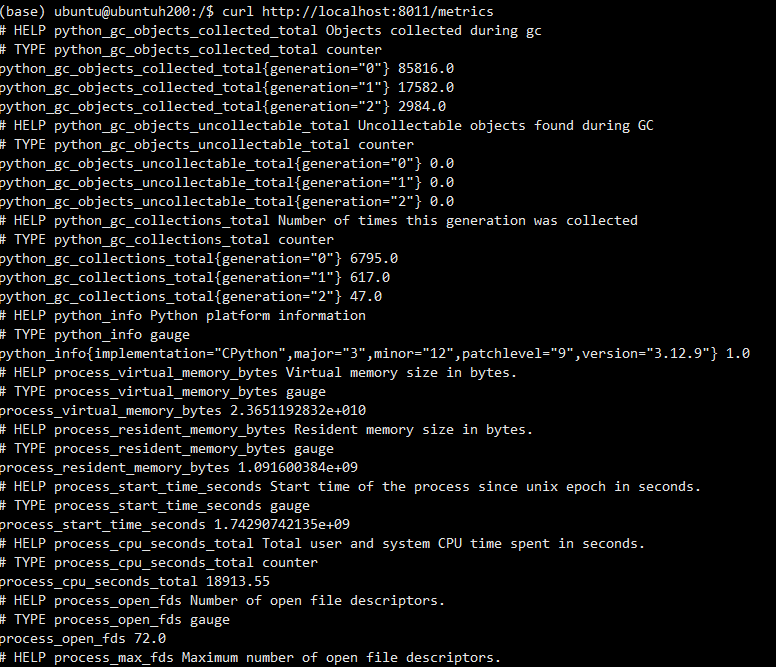
查看监控指标:curl http://localhost:8011/metrics
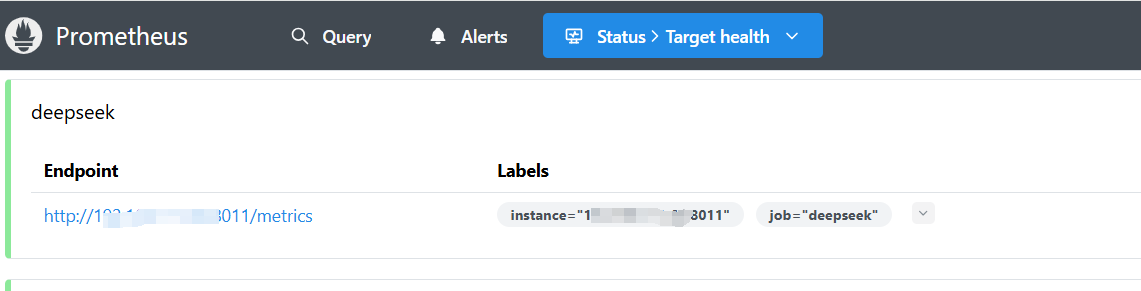
 二、Prometheus 接入
安装不做说明,配置添加如下:
  - job_name: "deepseek"
    static_configs:
      - targets: ["192.168.1.6:8011"]
启动Prometheus,浏览器访问
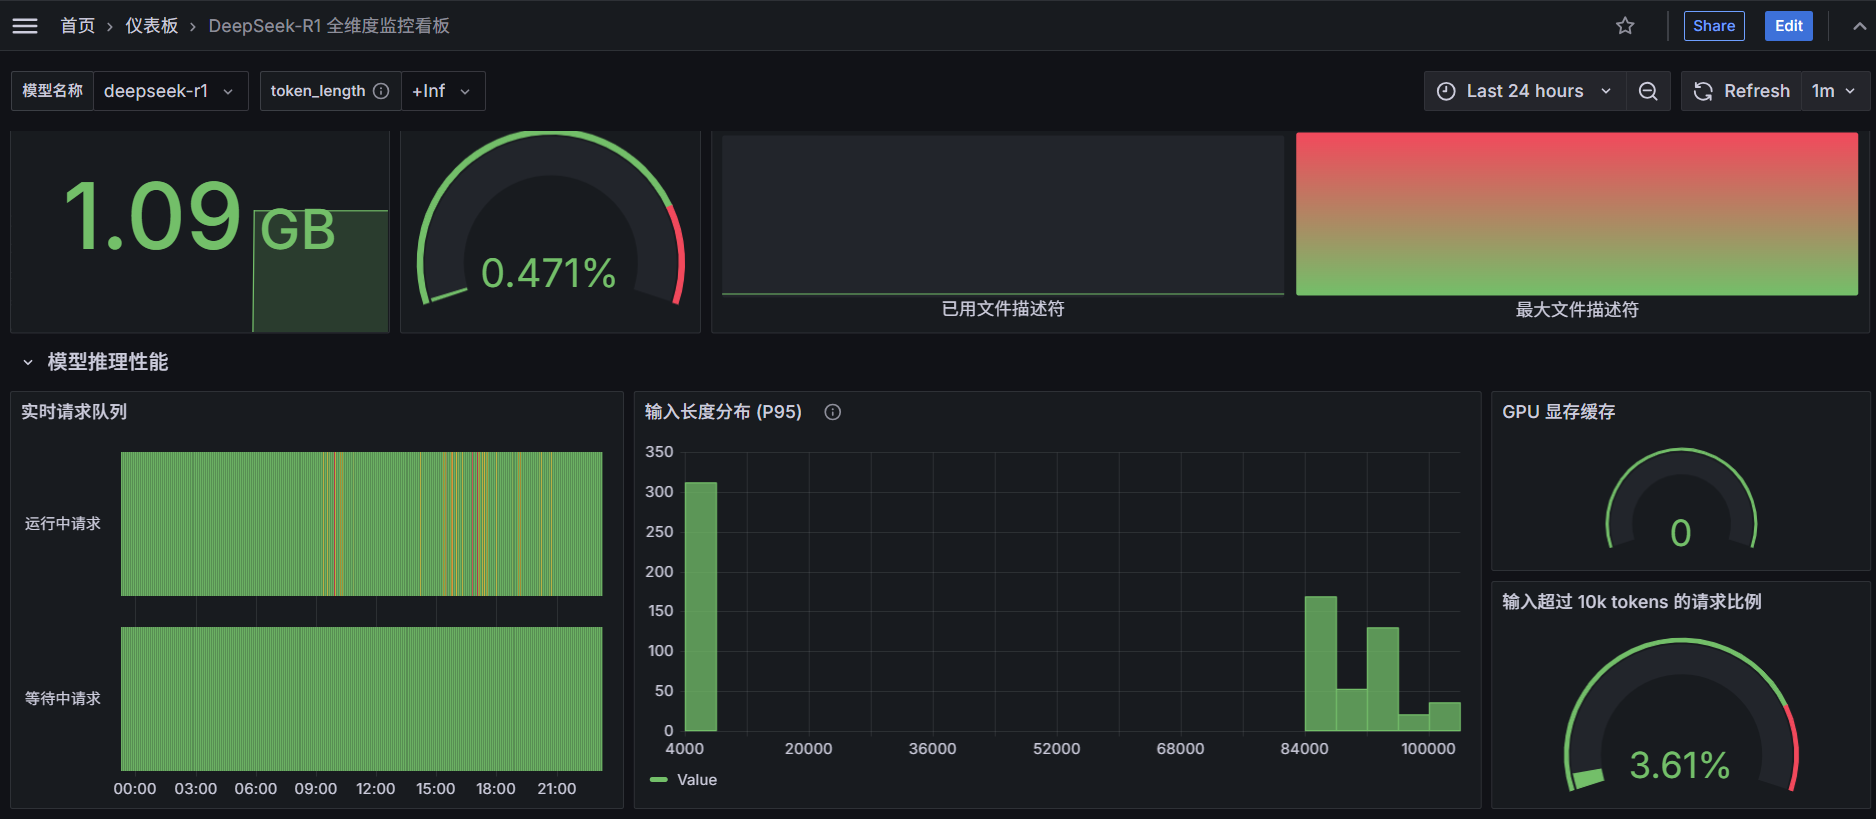
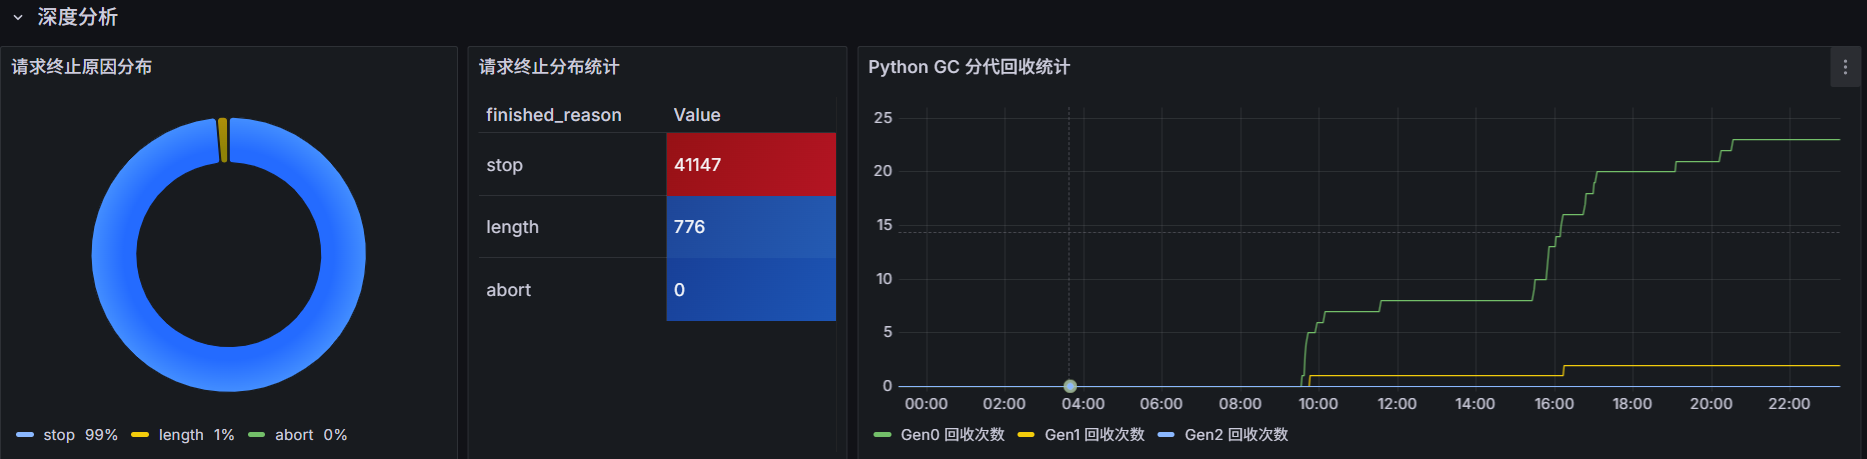
三、grafana可视化展示
添加数据源(配置上面安装的Prometheus),新增仪表盘,监控大致如下图所示:
四、Prometheus告警规则
groups:
- name: node_alert
rules:
- alert: 文件描述符告警
expr: (process_open_fds / process_max_fds) > 0.9
for: 10m
labels:
severity: warning
category: system
annotations:
summary: "文件描述符使用超警戒线 (实例 {{ $labels.instance }})"
curvalue: "当前值: {{ printf \"%.2f\" $value }}%"
description: |-
近10分钟当前文件描述符使用率已达 {{ printf "%.2f" $value }}% {{ "\n" }}
{{- $open_fds_query := printf "process_open_fds{instance=\"%s\"}" $labels.instance | query -}}
{{- $max_fds_query := printf "process_max_fds{instance=\"%s\"}" $labels.instance | query -}}
{{- $open_fds := $open_fds_query | first -}}
{{- $max_fds := $max_fds_query | first -}}
{{- if $open_fds -}}
已打开数量: {{ $open_fds | value | printf "%.0f" }}{{ "\n" }}
{{- end -}}
{{- if $max_fds -}}
系统最大限制: {{ $max_fds | value | printf "%.0f" }}{{ "\n" }}
{{- end -}}
建议操作:
1. 立即检查文件描述符泄漏 (参考 lsof -p <PID>)
2. 调整系统限制 /etc/security/limits.conf
3. 优化长连接资源释放机制
- alert: GPU 缓存压力告警
expr: vllm:gpu_cache_usage_perc >= 95
for: 5m
labels:
severity: high
category: gpu
annotations:
summary: "GPU 显存缓存超载 (模型 {{ $labels.model_name }})"
curvalue: "当前值: {{ $value | humanizePercentage }}"
description: |-
近5分钟模型 {{ $labels.model_name }}实例{{ $labels.instance }} KV 缓存使用率已持续超过 95%
当前值: {{ $value | humanizePercentage }}
影响风险:
- 可能触发 OOM 导致服务中断
- 推理延迟显著增加
优化方案:
1. 扩容 GPU 显存资源
2. 调整 --gpu_memory_utilization
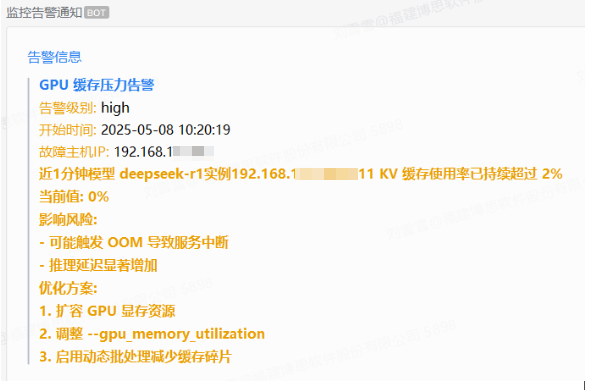
3. 启用动态批处理减少缓存碎片五、告警通知
基于alertmanager + PrometheusAlert+企业微信机器人实现告警通知,这里不做说明,最终实现效果如下:

火山引擎开发者社区是火山引擎打造的AI技术生态平台,聚焦Agent与大模型开发,提供豆包系列模型(图像/视频/视觉)、智能分析与会话工具,并配套评测集、动手实验室及行业案例库。社区通过技术沙龙、挑战赛等活动促进开发者成长,新用户可领50万Tokens权益,助力构建智能应用。
更多推荐
 5
5 0
0- 0


 已为社区贡献1条内容

所有评论(0)