使用scottplot绘制曲线,横坐标精确到时分秒
·
使用scottplot绘制曲线,横坐标精确到时分秒
ScottPlot 5.0
using ScottPlot;
using ScottPlot.DataGenerators;
using ScottPlot.WinForms;
using System;
using System.Collections.Generic;
using System.ComponentModel;
using System.Data;
using System.Drawing;
using System.Linq;
using System.Text;
using System.Threading.Tasks;
using System.Windows.Forms;

namespace ScottPlot5WinFormsDemo.Demo
{
    public partial class DataLogger2 : Form, IDemoWindow
    {
        public string Title => "实时数据增长图";

        public string Description => "将实时流数据绘制为增长线图。";
        public string ClassName => "DataLogger";
        readonly Timer AddNewDataTimer = new Timer() { Interval = 1000, Enabled = true };
        public List<double> ys = new List<double>();
        public DataLogger2()
        {
            InitializeComponent();
            Random rand = new Random(BitConverter.ToInt32(Guid.NewGuid().ToByteArray(), 0));
            Plot myPlot = formsPlot1.Plot;
            DateTime start = DateTime.Now;
            //ys.Add(Math.Round(rand.NextDouble(), 2, MidpointRounding.AwayFromZero));
            var sig = myPlot.Add.Signal(ys);
            sig.Data.XOffset = start.ToOADate();
            sig.Data.Period = 1.0 / (3600 * 24); // one day between each point
            myPlot.Axes.DateTimeTicksBottom();
            formsPlot1.Plot.Axes.SetLimitsY(bottom: 0, top: 1);
            myPlot.Axes.AutoScale();
            formsPlot1.Refresh();
            AddNewDataTimer.Tick += (s, e) =>
            {
                ys.Add(Math.Round(rand.NextDouble(), 2, MidpointRounding.AwayFromZero));
                //ys.Add(0.5);
                myPlot.Axes.AutoScale();
                formsPlot1.Refresh();
            };
        }


    }
}
效果
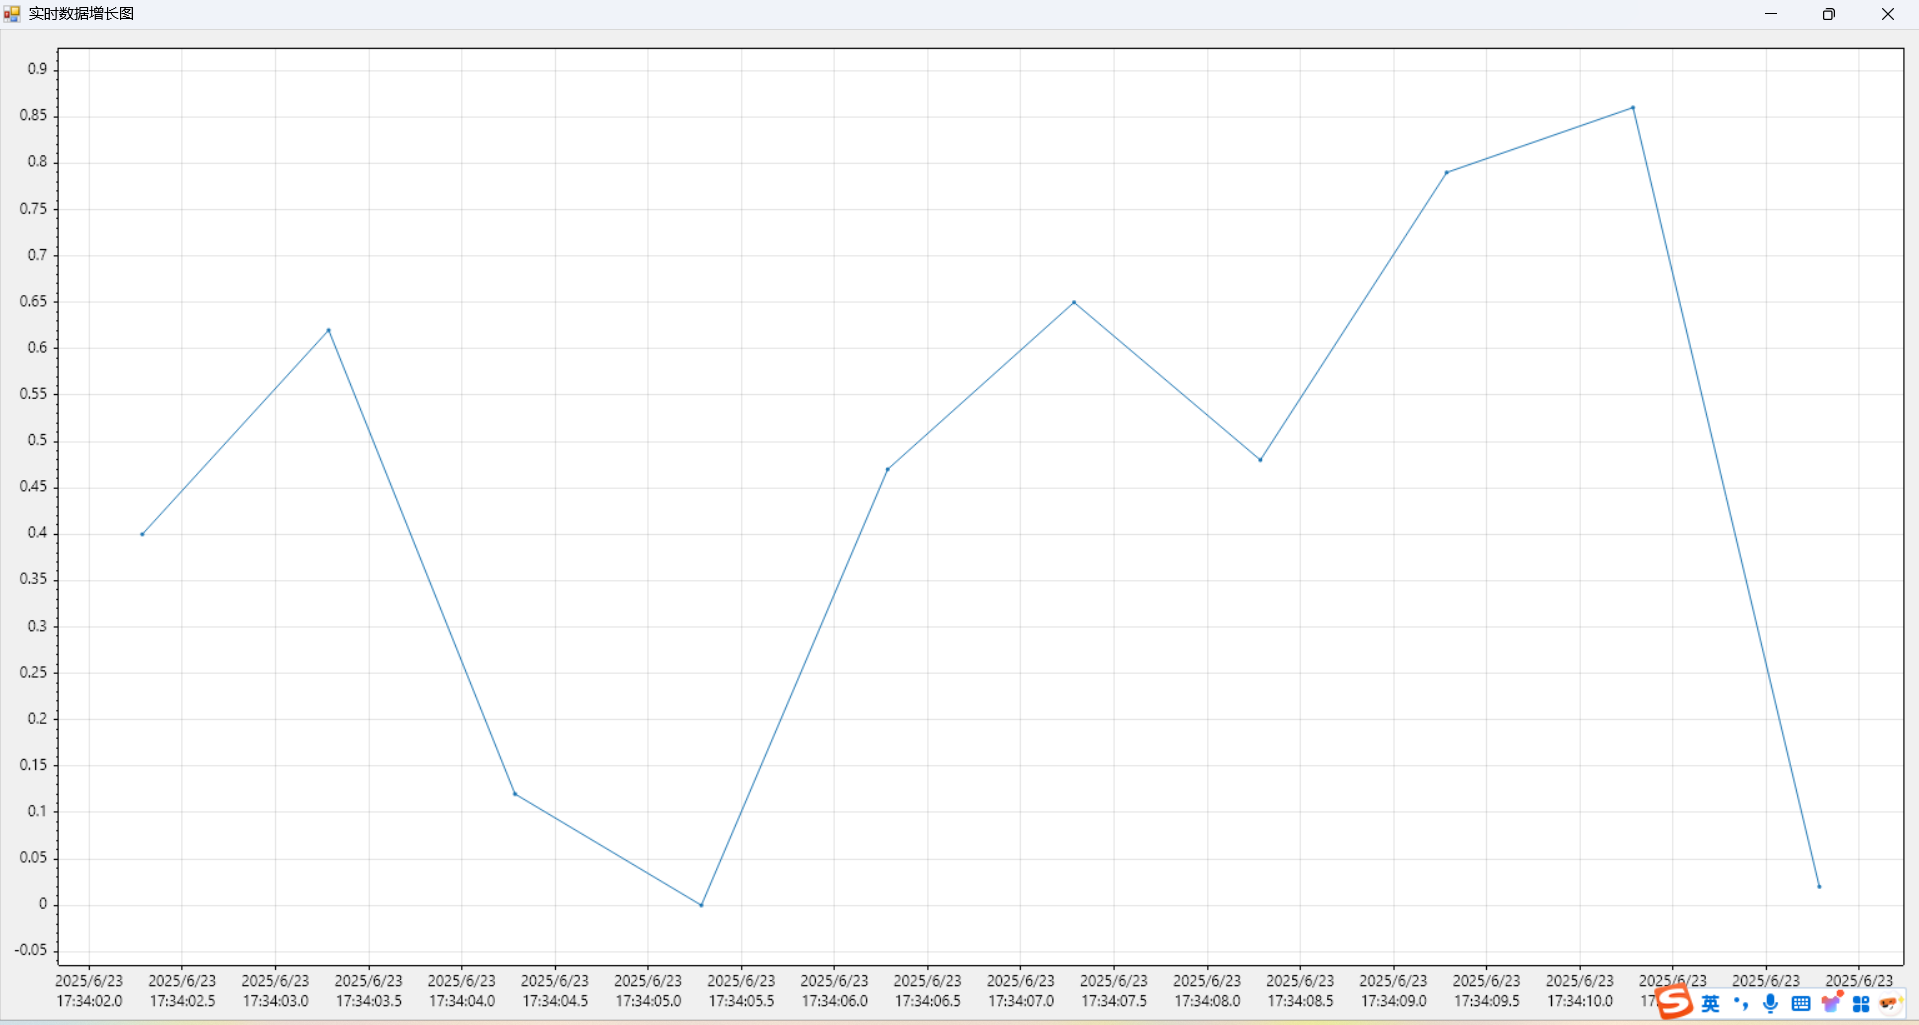
改进版
using ScottPlot;
using ScottPlot.DataGenerators;
using ScottPlot.WinForms;
using System;
using System.Collections.Generic;
using System.ComponentModel;
using System.Data;
using System.Diagnostics;
using System.Drawing;
using System.Globalization;
using System.Linq;
using System.Text;
using System.Threading.Tasks;
using System.Windows.Forms;

namespace ScottPlot5WinFormsDemo.Demo
{
    public partial class DataLogger2 : Form, IDemoWindow
    {
        public string Title => "实时数据增长图2";

        public string Description => "将实时流数据绘制为增长线图。";
        public string ClassName => "DataLogger";
        readonly Timer AddNewDataTimer = new Timer() { Interval = 1000, Enabled = true };
        readonly Timer UpdatePlotTimer = new Timer() { Interval = 50, Enabled = true };

        readonly ScottPlot.Plottables.DataLogger Logger1;

        readonly RandomWalker Walker1 = new RandomWalker(0, multiplier: 0.1);
        public DataLogger2()
        {
            InitializeComponent();
            Random rand = new Random(BitConverter.ToInt32(Guid.NewGuid().ToByteArray(), 0));
            Plot myPlot = formsPlot1.Plot;
            DateTime start = DateTime.Now;
            // 创建记录器并将其添加到绘图中
            Logger1 = formsPlot1.Plot.Add.DataLogger();
            // 对第一个记录器使用左轴
            ScottPlot.AxisPanels.LeftAxis axis1 = formsPlot1.Plot.Axes.AddLeftAxis();
            Logger1.Axes.YAxis = axis1;
            axis1.Color(Logger1.Color);
            // 设置底部轴以使用DateTime标记
            var axis = formsPlot1.Plot.Axes.DateTimeTicksBottom();
            // apply our custom tick formatter
            var tickGen = (ScottPlot.TickGenerators.DateTimeAutomatic)axis.TickGenerator;
            tickGen.LabelFormatter = CustomFormatter;
            //var sw = Stopwatch.StartNew();
            DateTime lastTime = DateTime.MinValue;
            AddNewDataTimer.Tick += (s, e) =>
            {
                //double x = sw.Elapsed.TotalSeconds;
                DateTime now = DateTime.Now;
                if (now > lastTime)
                {
                    lastTime = now;
                    Logger1.Add(now.ToOADate(), Math.Round(rand.NextDouble(), 2));
                }
                DateTime start2 = DateTime.Now;
                double y = Math.Round(rand.NextDouble(), 2, MidpointRounding.AwayFromZero);
                //Logger1.Add(x, Math.Round(rand.NextDouble(), 2));
                myPlot.Axes.AutoScale();
            };
            UpdatePlotTimer.Tick += (s, e) =>
            {
                if (Logger1.HasNewData)
                    formsPlot1.Refresh();
            };
        }

        /// <summary>
        /// 创建自定义格式化程序以返回字符串
        /// 仅在缩小时显示日期,仅在放大时显示时间
        /// </summary>
        /// <param name="dt"></param>
        /// <returns></returns>
        public string CustomFormatter(DateTime dt)
        {
            if (dt.TimeOfDay == TimeSpan.Zero)  // 检测午夜
            {
                return dt.ToString("d");  // 短日期格式
            }
            else
            {
                // 包含AM/PM标识的完整时间
                return dt.ToString("HH:mm:ss", CultureInfo.InvariantCulture);
                // 示例: "02:30:45"
            }
        }

    }
}

中国智能体开发者社区,聚焦智能体与大模型开发,提供前沿资讯、实用工具链、开源项目及行业案例。通过技术沙龙、开发者大赛等活动,促进经验交流与协作,助力开发者快速构建创新智能应用。
更多推荐


 1
1 0
0- 0


 已为社区贡献1条内容

所有评论(0)